vorza360 provides a full social media analytics report to track and measure your performance across all platforms. We offer expert social media analytics reporting services that turn complex data into simple, clear steps for your next strategy.
The Challenge: Yemi ran a consumer goods company whose marketing team produced monthly social media reports that were forty slides of platform-generated screenshots, reach, impressions, follower counts, and engagement rates presented without interpretation. The CEO had asked twice in quarterly reviews what the social media investment was contributing to business results, and both times the marketing team had been unable to answer. The next review was three months away and the social media budget was at risk.
The vorza360 Solution: We rebuilt the Social Media Analytics & Reporting framework for Yemi’s company, connecting social media metrics to the business outcomes that mattered to the CEO. We built a commercial attribution model that tracked the path from social media content to website visit to product enquiry for each platform. We redesigned the monthly report to lead with three business-outcome metrics, website referral traffic, qualified leads attributed to social, and estimated revenue contribution, before supporting with the platform engagement data that explained the performance drivers.
The Result: The next quarterly review was the first time the marketing team could answer the CEO’s question with a number. Social media was contributing 9% of website traffic and 14% of digital-sourced leads on an assisted attribution basis, a meaningful contribution that justified the investment. The social media budget was maintained rather than cut, and Yemi described the reporting framework as having changed the nature of the social media conversation at executive level from a qualitative defence to a quantitative justification.
Magnus Lindqvist (Sweden)
The Challenge: Magnus managed a B2B technology company whose social media team was posting consistently and reporting strong engagement metrics but was unable to demonstrate any connection to the pipeline activity the sales team cared about. Marketing and sales were operating with completely different performance frameworks, marketing reported on reach and engagement, sales reported on qualified leads and pipeline value. The disconnect was creating internal tension and questioning the value of the social media investment.
The vorza360 Solution: We built a Social Media Analytics & Reporting system that bridged the marketing-sales measurement gap. We implemented UTM tracking on all social media links that allowed pipeline contacts to be traced back to their social media interaction history in the CRM. We built a monthly report that showed, for each active pipeline deal, the social media touchpoints that had occurred in the contact’s history, turning social media from an invisible influence into a tracked contributor to the pipeline.
The Result: The first report using the new framework showed that 34% of active pipeline deals had at least one social media touchpoint in the contact’s history, primarily LinkedIn content engagement. The sales team’s scepticism about social media shifted significantly when they could see specific deals with social media interactions in the contact’s history. Magnus described the CRM-connected reporting as having solved the attribution argument between marketing and sales by replacing opinion with traceable data.
Chidinma Obi (Nigeria)
The Challenge: Chidinma managed social media for a hospitality chain. The team was posting across four platforms and producing platform-native reports each month, but without a unified view of performance across the portfolio it was impossible to make rational decisions about where to concentrate investment. Platform managers each advocated for their own platform’s performance, and without a comparative framework, resource allocation was driven by internal politics rather than performance data.
The vorza360 Solution: We built a unified Social Media Analytics & Reporting dashboard that pulled performance data from all four platforms into a single comparative framework. We standardised the metrics across platforms, converting each platform’s native engagement metrics into a common engagement rate formula that allowed direct comparison. We built a content performance analysis that identified the content types, topics, and formats that performed above average across all platforms, providing a data-based creative brief for the content team.
The Result: The unified reporting dashboard ended the platform-by-platform budget advocacy in monthly planning meetings. The first report using the comparative framework revealed that one platform was generating three times the engagement rate at one third of the resource investment compared to the lowest-performing platform. Resource was rebalanced within the same total budget, and overall social media performance improved by 38% in the following quarter. Chidinma described the comparative reporting as having made resource allocation a data conversation rather than an advocacy competition.
Hana Park (South Korea)
The Challenge: Hana ran an e-commerce company that was running both organic social media and paid social advertising simultaneously but had no integrated view of how they interacted. Organic and paid performance were reported separately by different team members, making it impossible to understand whether the organic content was assisting paid conversion, whether paid retargeting was capturing the audience organic content was generating, or whether the two were reaching the same people twice without multiplying effect.
The vorza360 Solution: We built an integrated Social Media Analytics & Reporting framework that treated organic and paid as a single ecosystem. We mapped the content overlap between organic audiences and paid retargeting pools, and identified the content types that had the highest correlation with paid conversion, organic posts that functioned as effective top-of-funnel primers for paid retargeting. We built a combined attribution report that showed the full social media path to conversion including both organic and paid interactions.
The Result: The integrated reporting revealed that users who had engaged with organic content before being reached by retargeting ads converted at 2.6 times the rate of users who had only seen paid ads, a finding that justified increasing organic content investment in the top-of-funnel categories that showed the highest retargeting conversion correlation. Hana described the integrated reporting as having uncovered a dynamic that had been invisible when organic and paid were reported separately, enabling a budget reallocation that improved overall social ROI significantly.
Rolf Andersen (Norway)
The Challenge: Rolf managed a media company whose social media team produced weekly internal performance updates. The updates were data-dense but un-interpreted, raw numbers without context, without comparison to previous periods, and without identification of what had driven changes. The social media team knew the data but couldn’t effectively communicate it, and leadership was left uncertain about whether social media performance was improving, declining, or stable.
The vorza360 Solution: We designed a Social Media Analytics & Reporting format for Rolf’s company that structured data presentation around narrative rather than numbers, each weekly update identified the single most significant performance movement, explained the likely cause in plain language, and described the specific action the team was taking in response. We built benchmark comparisons that showed each metric in the context of the previous four weeks and the same period the previous year, so any number had automatic context.
The Result: Leadership engagement with the weekly social media reports improved visibly, questions in review meetings shifted from ‘what do these numbers mean?’ to substantive conversations about the platform strategy. Two editorial decisions in the following quarter were directly informed by the analytics data presented in the new format. Rolf described the reporting redesign as having changed social media analytics from a performance log that leadership couldn’t interpret into a management tool they were actively using.
Amara Kouyaté (Guinea)
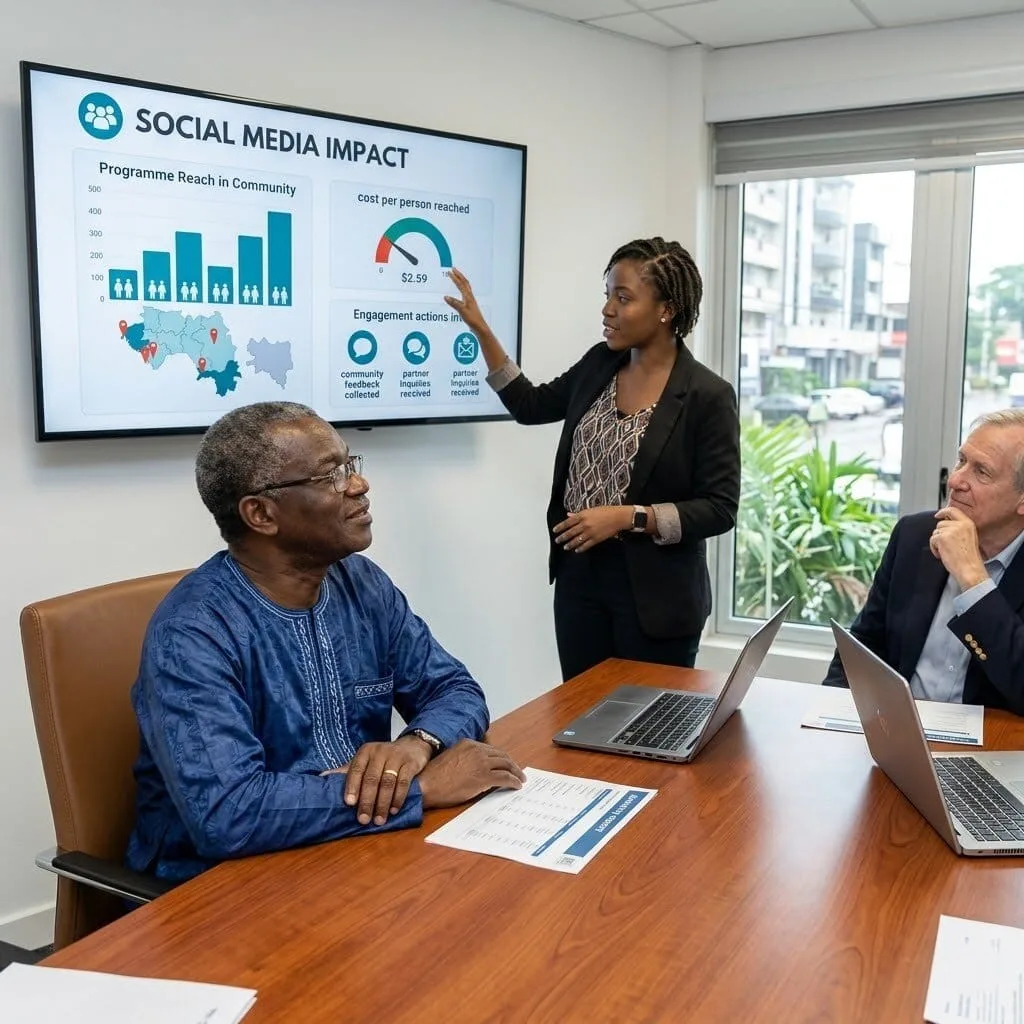
The Challenge: Amara ran a development NGO that reported social media performance to its board quarterly. Board members were experienced programme professionals but not digital marketers, they couldn’t interpret engagement rate benchmarks, impression volumes, or reach statistics, and the social media reports they received produced confusion and occasionally undermined confidence in the team rather than building it.
The vorza360 Solution: We redesigned the Social Media Analytics & Reporting for board-level consumption, translating all social media metrics into language and frameworks familiar to programme professionals. We replaced engagement rates with programme reach equivalents, ‘this content reached 12,400 people in the communities where our programmes operate.’ We replaced impression volume with equivalent staff time comparisons. We built the quarterly report around three programme-aligned questions: how many people did we reach, what did they do in response, and what did it cost per person reached.
The Result: Board reception of the new social media report format was immediately positive, members described it as the first social media update they had found genuinely informative rather than confusing. Two board members began engaging with the organisation’s social media personally after the new reports helped them understand the reach its content was generating. Amara described the reporting redesign as having converted a communication that had been creating doubt about the social media programme into one that was creating confidence in it.
Why We Turn Data Into Clear Insights
It’s not enough to post content; you need to know if that content is actually working for your business. Social Media Analytics and Reporting is the process of collecting data (like likes, shares, clicks, and sales) and making it easy to understand. We connect your social media activity directly to your business goals, showing you exactly what drives sales, what engages your audience, and how to improve your social media analytics and reporting strategy.
How we do it
We follow a systematic process to deliver accurate, easy-to-understand reports that guide your social media spending and planning.
Collect and Check Data
We gather all the performance numbers from your social media channels and ensure the data is accurate. We use social media analytics reporting software to pull and prepare the information.
Find the Key Trends
We analyze the numbers to find out what is actually working: which posts got the most shares, which platform sent the most traffic, and which ad spent money best.
Deliver Simple Recommendations
We create a clear social media analytics report that highlights the most important successes and gives you simple, prioritized advice on what to post next to grow your business faster.
Collect and Check Data
We gather all the performance numbers from your social media channels and ensure the data is accurate. We use social media analytics reporting software to pull and prepare the information.
Find the Key Trends
We analyze the numbers to find out what is actually working: which posts got the most shares, which platform sent the most traffic, and which ad spent money best.
Deliver Simple Recommendations
We create a clear social media analytics report that highlights the most important successes and gives you simple, prioritized advice on what to post next to grow your business faster.
Here is what our Clients are saying About us
Marcus Hoffmann (Germany)
vorza360 provides monthly social media reports that connect our social performance to business outcomes rather than stopping at engagement metrics. Reporting that helps us make better decisions about content investment and platform focus.
Hana Al-Sayed (Kuwait)
vorza360 set up our social media analytics infrastructure and produces reporting that gives our marketing leadership clear visibility into what is working and what is not. Data-led social media management rather than intuition-led.
Alexandru Vasile (Romania)
vorza360 produces social media analytics reports for our brand that identify performance trends, content insights, and audience growth patterns. Reporting our team finds useful rather than PDF reports that answer no questions.
Priya Sharma (India)
vorza360 built social media attribution reporting for our e-commerce brand that shows the revenue contribution of our social channels. Demonstrating social media’s business impact to our CFO has improved our marketing budget allocation.
Anisa Putri (Indonesia)
vorza360 provides social media reporting for our brand with competitor benchmarking included. Understanding how we perform relative to competitors on social gives our strategy clear direction.
Kwame Asante (Ghana)
vorza360 provides social media analytics reporting for our brand that our non-marketing leadership team can understand and act on. Reporting that communicates clearly rather than impresses with complexity.
More about SMM
Social Media Strategy & Planning
vorza360 offers specialized social media strategy and planning services to create a clear…
Got questions? We’ve got answers. Find everything you need to know about using our platform, plans, and features
What does vorza360's Social Media Analytics and Reporting service provide, and why does it matter?
Most businesses post on social media without truly understanding whether it is working, they see likes and followers but cannot connect those numbers to business outcomes. vorza360’s Social Media Analytics and Reporting service bridges this gap by setting up accurate, comprehensive tracking across all your platforms and delivering clear monthly reports that translate complex engagement data into simple, actionable business insights. We connect your social media activity directly to your business goals, showing you which content drives real website traffic, which platform generates actual leads, which ad campaigns deliver the best ROI, and where the next period’s social investment should be focused. This intelligence makes every future social media decision faster, smarter, and more profitable.
What data does vorza360 track and how is it collected?
We collect data from multiple sources to build a complete picture of your social media performance. Platform-native analytics tools, Facebook Business Suite, Instagram Insights, LinkedIn Analytics, TikTok Analytics, YouTube Analytics, and Twitter/X Analytics, provide organic performance data including reach, impressions, engagement rates, follower demographics, and content performance. Paid campaign data from Facebook Ads Manager, LinkedIn Campaign Manager, and TikTok Ads Manager tracks ad spend, reach, click-through rates, and conversion events. Google Analytics tracks the downstream website behavior of social media visitors, showing us whether they convert to leads or customers after arriving from social. We use social media analytics reporting software such as Sprout Social or Hootsuite to consolidate all data sources into unified dashboards for efficiency.
What does a vorza360 Social Media Analytics monthly report contain?
Our monthly Social Media Analytics Reports are structured for clarity and action. Each report contains: an Executive Summary highlighting the headline results for the period; an Audience Growth overview tracking follower counts and growth rates across each platform; a Content Performance Analysis ranking the top-performing posts by reach and engagement to identify what resonated most; a Paid Campaign Performance breakdown showing spend, results, and cost per result for all active ad campaigns; a Website Traffic Report attributing traffic and conversion events to specific social channels and campaigns; a Competitor Comparison showing how your engagement and growth rates compare to key rivals; and a Recommendations Section clearly stating what the data suggests for the next month’s content and campaign priorities.
How does vorza360 connect social media performance to actual revenue and business results?
Connecting social activity to revenue requires proper conversion tracking setup, which we configure at the start of every engagement. We install platform tracking pixels (Meta Pixel, LinkedIn Insight Tag, TikTok Pixel) on your website and configure goal events that register every meaningful conversion: form submissions, product purchases, phone call initiations, and appointment bookings. For paid campaigns, this enables revenue attribution, showing exactly how much revenue each campaign, ad set, or individual ad generated, and calculating a precise Return on Ad Spend. For organic content, we use UTM parameter tracking in all social links to attribute website sessions and conversions to specific platforms and individual posts, giving you a complete view of organic social’s contribution to your revenue.
How does vorza360 use analytics to continuously improve social media performance?
Analytics data drives every optimization decision in our social media campaigns. Each month, we identify the highest-performing content pieces by engagement rate and business impact, and build the next month’s content strategy to produce more of what is working, replicating successful formats, topics, posting times, and visual styles. We identify underperforming content categories and reduce or eliminate them. For paid campaigns, we use performance data to reallocate budget from poor-performing ad sets to top performers, refine audience targeting based on conversion data, and develop new creative concepts for A/B testing. This data-driven optimization loop ensures your social media performance continuously improves month over month rather than plateauing after an initial launch period.