Gain total visibility into your cloud with vorza360’s Azure monitoring and analytics services. We use real-time data to keep your apps fast, your costs low, and your business running perfectly.
The Challenge Bram runs a high-traffic online auction house in Amsterdam. During the final minutes of a big bidding war, thousands of users hit his site at once. In the past, his servers would occasionally “choke” under the pressure, causing the site to lag and leaving bidders frustrated. Bram could see that something was wrong, but he had no way of knowing why it was happening or how to stop it before the next big event. He needed total visibility into his cloud to protect his reputation.
The vorza360 Solution We acted as Bram’s digital detectives by setting up a “central brain” using an Azure monitor and log analytics workspace. We didn’t just wait for a crash; we used Azure stream analytics monitoring to spot bidding patterns in real-time. By using Application Insights, we tracked exactly how his customers moved through the auction process. It’s like having a high-tech control room with a hundred screens, we can see a “traffic jam” forming blocks away and clear the path before the first bidder even taps their screen.
The Result Bram’s auctions now run with zero lag, even during record-breaking sales. He loves theAzure workbooks we built for him, which turn his raw data into beautiful, easy-to-read charts that show his business health at a single glance. He values the proactive “Smart Alerts” we tuned so he only gets notified when it truly matters, keeping his stress levels low and his auction house fast.
Elara Vance (Canada)
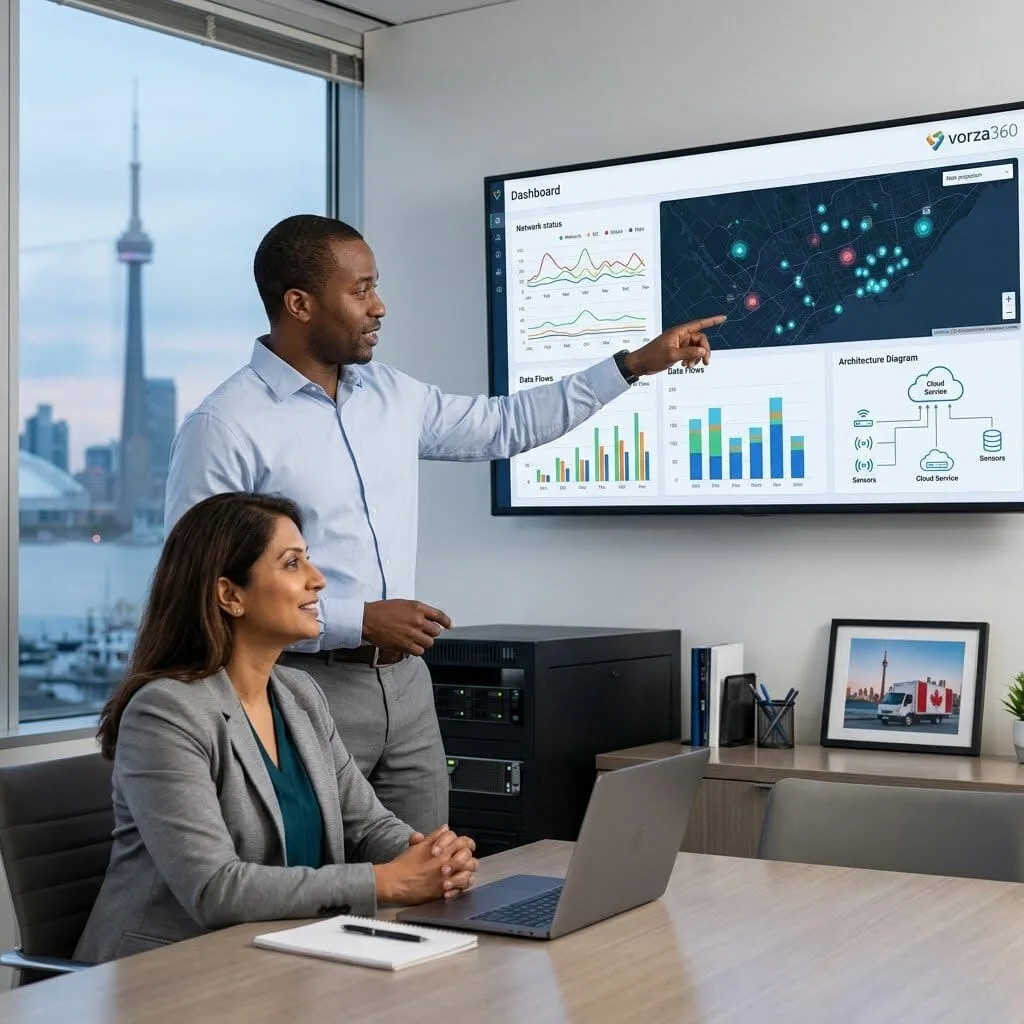
The Challenge Elara manages a large logistics firm in Toronto with hundreds of smart sensors (IoT) on her delivery trucks and several on-premises servers in her warehouse. She was struggling to keep track of everything; her office computers were managed in one place, while her cloud apps were in another. She felt like she was trying to watch a movie through five different keyholes and needed a “single pane of glass” to see her entire operation.
The vorza360 Solution We provided a unified view of Elara’s business using Azure log analytics network monitoring. We used the Azure log analytics monitor Windows service to bridge the gap between her physical office in Canada and her cloud resources. Now, her truck sensors and warehouse servers all report to one dashboard. It is like replacing five small, blurry monitors with one massive, crystal-clear 4K screen, she can see her entire hybrid network moving in perfect harmony from her office in Toronto.
The Result Elara has reclaimed hours of her week because she no longer has to jump between different tools. Her Azure log analytics network performance monitor ensures her data travels at top speed, and she knows her digital safety nets are ready thanks to our Azure backup monitoring log analytics. She appreciates the easy words we used to explain her “hybrid office” and feels like she finally has a technical partner who sees the big picture.
Mateo Ricci (Italy)
The Challenge Mateo runs a specialized software house in Milan that builds complex apps using Node.js and Python. His biggest headache was “surprise bills” from the cloud; he knew he was spending a lot of money, but he couldn’t tell which apps were the most expensive or where he could save. He wanted to keep his apps fast but also needed to keep his costs low to stay competitive in the Italian market.
The vorza360 Solution We implemented an insightful strategy by combining his app performance data with his cloud spend into one clear view. We customized his Azure monitoring log analytics to alert him if a specific data script was running too long or costing too much. By using Log Analytics, we performed a deep-dive “root cause” analysis to find the technical mysteries that were draining his budget. It’s like having a digital accountant who is also a world-class engineer, someone who can tell you exactly which lightbulbs are wasting energy and how to make the whole building brighter for less money.
The Result Mateo has slashed his monthly cloud costs by 20% while actually increasing his app speeds. He loves the continuous optimization meetings where we review his data and find new ways to boost his efficiency. He values the human-centric approach vorza360 takes and the fact that we translated his millions of data points into simple, actionable insights for his team in Milan.
Sophie Lefebvre (France)
The Challenge Sophie manages a busy medical platform in Paris that relies on a massive SQL Server database. Her team was suffering from “alert fatigue”, they were getting hundreds of emails every day for minor glitches, which meant they started ignoring their phones entirely. When a real issue finally happened, no one noticed until the platform went offline. She needed Azure monitoring and analytics services that were smart enough to tell the difference between a “hiccup” and a “heart attack.”
The vorza360 Solution We followed our professional service cycle to perform a deep “Metric Audit” of Sophie’s platform. We set up “Threshold Tuning,” which acts as a smart filter for her notifications. Now, her team only gets an alert if a server truly reaches its limit or if a critical SQL Server database slows down. We created a custom visual board using Azure Monitor that shows her platform’s “pulse” in real-time. It is like moving from a noisy room where everyone is shouting to a quiet office where a bell only rings when there is a guest at the door.
The Result The “alert fatigue” at Sophie’s firm has vanished. Her developers are happier and more focused, and the platform has reached its highest uptime ever. She values the Azure analytics we use to keep her critical databases healthy and the fact that vorza360 makes the technology disappear into the background so she can focus on her patients in France.
Liam O’Connor (Ireland)
The Challenge Liam’s tech startup in Dublin uses a mix of .NET and Go to power a high-speed financial tool. He was worried that as his company grew, he wouldn’t be able to keep up with the “digital noise” of his expanding infrastructure. He needed to know that his Azure backup monitoring log analytics were working and that his entire network, from his office to the edge, was secure and fast.
The vorza360 Solution We acted as Liam’s expert guides, building a robust Azure monitor and log analytics workspace that scales with his business. We used Azure accelerated networking insights to ensure his financial data moves in the blink of an eye. We also set up deep performance tracking for his .NET software, ensuring his core business tools remain stable. It is like building a high-speed railway that automatically adds new tracks and stations as more passengers arrive, ensuring the train never slows down.
The Result Liam’s startup is now a model of technical efficiency in Ireland. He has total visibility into his cloud and feels confident that his business is running perfectly. He loves the tailored solutions we provided for his unique “pulse” and appreciates the professional, human-first service that turns complex data into clear business wins.
How we do it
We turn millions of data points into simple, actionable insights that help you make better business decisions.
Creative Approaches
We don’t just watch for crashes; we use Azure stream analytics monitoring to spot patterns in real-time. This allows us to predict a busy shopping hour or a system lag before your customers ever feel it.
Insightful Strategies
Our team sets up an Azure monitor and log analytics workspace to act as a “central brain” for your business. We combine your app performance and your cloud spend into one clear view, helping you save money while staying fast.
Tailored Solutions
Every business has a unique “pulse.” We customize your Azure monitoring log analytics to alert you only for what matters whether that’s a server reaching its limit or a successful backup completion.
Creative Approaches
We don’t just watch for crashes; we use Azure stream analytics monitoring to spot patterns in real-time. This allows us to predict a busy shopping hour or a system lag before your customers ever feel it.
Insightful Strategies
Our team sets up an Azure monitor and log analytics workspace to act as a “central brain” for your business. We combine your app performance and your cloud spend into one clear view, helping you save money while staying fast.
Tailored Solutions
Every business has a unique “pulse.” We customize your Azure monitoring log analytics to alert you only for what matters whether that’s a server reaching its limit or a successful backup completion.
Tools
Tools vorza360 Offers for This Service
Azure Monitor
The core engine we use to collect “metrics” (the numbers) and “logs” (the stories) from your entire network.
Log Analytics
A powerful search tool we use to dig deep into your data and find the “root cause” of any technical mystery.
Application Insights
A specialized plugin we add to your apps to track exactly how your customers are using them.
Azure Workbooks
Custom-built visual reports that turn your raw data into beautiful, easy-to-read charts for your team.
Multiple Platform Support
vorza360 provides a unified “single pane of glass” to watch over your business, no matter where your data lives.
Microsoft Azure
Deep, native monitoring for every service from databases to virtual machines.
On-Premises Servers
We use Azure log analytics monitor Windows service to keep track of the physical computers in your office.
Multi-Cloud Environments
Bridging the gap so you can watch your AWS or Google Cloud resources alongside Azure.
Hybrid Networks
Using Azure log analytics network monitoring to ensure the connection between your office and the cloud is always strong.
Edge & IoT Devices
Monitoring thousands of smart sensors and devices in real-time using Stream Analytics.
Backup & Recovery Systems
Expert Azure backup monitoring log analytics to ensure your digital safety nets are always ready.
Microsoft Azure
Deep, native monitoring for every service from databases to virtual machines.
On-Premises Servers
We use Azure log analytics monitor Windows service to keep track of the physical computers in your office.
Multi-Cloud Environments
Bridging the gap so you can watch your AWS or Google Cloud resources alongside Azure.
Hybrid Networks
Using Azure log analytics network monitoring to ensure the connection between your office and the cloud is always strong.
Edge & IoT Devices
Monitoring thousands of smart sensors and devices in real-time using Stream Analytics.
Backup & Recovery Systems
Expert Azure backup monitoring log analytics to ensure your digital safety nets are always ready.
Multiple Framework Support
.NET
Deep performance tracking for your core Windows-based business software.
Java
Monitoring large-scale enterprise systems to ensure they remain stable and fast.
Node.js
Tracking real-time web traffic and event-driven applications effortlessly.
Python
Analyzing data scripts and automation tasks to ensure they finish on time.
PHP
Watching over your web servers and sites to prevent slow-loading pages.
Ruby
Keeping your startup apps and web tools running smoothly and efficiently.
Go
Performance monitoring for modern, high-speed cloud infrastructure tools.
SQL Server
Specialized performance monitoring using Azure analytics for your critical databases.
Custom Headless Development
We are an eCommerce website design company, that uses the best creative skills to meet your business needs and ensure customer satisfaction. We’re with you every step of the way, from the beginning of your project to its completion.
Fashion & Apparel
Food & Grocery
Retail
FMCG
Real Estate
Construction
Hotel
Healthcare
Telecom
Fintech
Manufacturing
Automotive
Our Service Cycle
We provide a clear path from digital “noise” to business “clarity.”
Step 1
Metric Audit
Step 2
Workspace Setup
Step 3
Network Mapping
Step 4
Threshold Tuning
Step 5
Dashboard Design
Step 6
Continuous Optimization
Step 1
Metric Audit
We identify which parts of your business need the most attention and set up our first sensors.
Step 2
Workspace Setup
Our team builds your Azure monitor and log analyticsworkspace to gather all your data in one safe spot.
Step 3
Network Mapping
We configure Azure log analytics network performance monitor to ensure your data travels at top speed.
Step 4
Threshold Tuning
We set up “Smart Alerts” so you only get notified for real issues, avoiding “alert fatigue.”
Step 5
Dashboard Design
We create custom visual boards so you can see your business health at a single glance.
Step 6
Continuous Optimization
We meet regularly to review your data and find new ways to boost speed and lower costs.
Here is what our Clients are saying About us
Kalle Mäkinen (Finland)
We had no meaningful visibility into what was happening in our Azure environment until vorza360 set up a proper monitoring strategy using Azure Monitor and Log Analytics. Within a week of deployment, we’d already identified and resolved two performance issues we hadn’t known existed.
Fatima Al-Dosari (Qatar)
vorza360 built comprehensive Azure Monitor dashboards for our operations team that surface the metrics that actually matter for our applications rather than exposing raw Azure metrics that require specialist interpretation. Our on-call team can now understand the health of the environment at a glance.
Sorin Dumitrescu (Romania)
vorza360 configured Azure Application Insights for our web application so we have end-to-end transaction tracing, exception tracking, and user behaviour analytics all flowing into a single workspace. When something goes wrong, we find the root cause in minutes rather than hours of log hunting.
Vikram Pillai (India)
vorza360 set up Azure Monitor alerts with proper severity levels and routing so the right team gets notified about the right type of issue at the right time. Our previous alerting had been all-or-nothing, either nobody got notified or everyone got paged for everything. The tiered approach vorza360 built is far more operational.
Cecilie Christoffersen (Denmark)
vorza360 implemented Azure Cost Management monitoring and budget alerts for our subscriptions so unexpected spend is caught early rather than discovered at month end. They also built custom workbooks that show cost trends by team and workload, which has made our internal cloud cost accountability conversations much more straightforward.
Tochukwu Okonkwo (Nigeria)
vorza360 set up a centralised Log Analytics workspace with data collection rules pulling diagnostic logs from every significant Azure resource in our environment. The ‘everything-in-one-place’ logging approach they designed means our security and operations teams both work from the same data source rather than looking in different places for the same events.
More about Microsoft Azure
Azure Virtual Machines
Scale your business effortlessly with vorza360’s expert Azure virtual machine services.
Got questions? We’ve got answers. Find everything you need to know about using our platform, plans, and features
What is Azure Monitor and how does vorza360 use it to maintain Azure environment health?
Azure Monitor is Microsoft’s comprehensive monitoring service for Azure, collecting metrics (numerical performance data sampled at regular intervals) and logs (structured event and diagnostic data) from Azure resources, operating systems, and applications, providing a centralized platform for visualization, analysis, and alerting. vorza360 uses Azure Monitor as the foundation of all Azure environment monitoring: we configure diagnostic settings on all Azure resources to route their metrics and logs to a central Log Analytics workspace, ensuring no telemetry is lost because it was not configured. We create Azure Monitor metric alerts for critical resource health indicators, VM CPU and memory, App Service response time and error rate, SQL Database DTU consumption, Key Vault availability. We use Azure Monitor Workbooks to create visual dashboards tailored to each stakeholder’s needs (an operations dashboard for the infrastructure team, a cost dashboard for finance). We configure Action Groups that define where alerts are sent, email, SMS, Teams webhook, PagerDuty, or automated runbooks for self-healing responses.
How does vorza360 use Azure Log Analytics for advanced monitoring and troubleshooting?
Azure Log Analytics is the query engine and repository within Azure Monitor, it stores all collected logs in a workspace and provides a powerful query language (Kusto Query Language, KQL) for searching, correlating, and analyzing log data at scale. vorza360 uses Log Analytics for: security event investigation (querying Azure AD sign-in logs for authentication anomalies, correlating firewall logs with unusual outbound connection patterns), performance troubleshooting (analyzing Application Insights traces to identify slow code paths, correlating VM performance data with application errors), cost analysis (querying Azure resource activity logs to understand what changed when costs increased), compliance reporting (generating regular reports on access patterns and security control compliance), and operational analytics (building dashboards that show the operational health of all systems at a glance). We build saved queries and detection rules as reusable assets in the Log Analytics workspace so investigations that were done once can be repeated and automated.
How does vorza360 implement Application Insights for application performance monitoring?
Application Insights is the Azure Monitor component specifically designed for application-level telemetry, capturing the performance and behavior of application code rather than just the infrastructure hosting it. vorza360 implements Application Insights by instrumenting application code with the SDK (for .NET, Java, Node.js, Python, or JavaScript) or enabling codeless monitoring for supported Azure compute services. Application Insights automatically captures HTTP request rates, response times, failure rates, and status codes; dependency calls to databases, external APIs, and Azure services with timing and error data; exceptions with full stack traces and contextual information; custom events and metrics defined by the application team; and user session data for web applications (with appropriate privacy controls). We configure Application Insights smart detection, which uses machine learning to identify anomalous performance degradation patterns (slow page loads, increased failure rates, unusual exception patterns) and alerts before they become significant enough to generate conventional threshold-based alerts.
How does vorza360 set up Azure Monitor alerts for proactive issue detection?
Effective Azure alerting requires careful design, too few alerts means issues are missed, too many generates alert fatigue where genuine alerts are buried in noise. vorza360 designs Azure Monitor alert rules using a tiered severity model: Sev0 (Critical) alerts for complete service unavailability, VM down, database unreachable, App Service returning 5xx errors for all requests, requiring immediate response at any hour. Sev1 (High) alerts for significant degradation, CPU consistently above 90 percent, error rate above 5 percent, disk space above 85 percent, requiring response within 1 to 4 hours. Sev2 (Medium) alerts for early warning indicators, disk space above 70 percent, elevated response times, requiring review within 24 hours. We configure Alert Processing Rules to suppress non-actionable alerts during planned maintenance Windows. We implement Azure Monitor alert notifications through Action Groups that route to appropriate recipients, on-call engineers via PagerDuty for Sev0, team email for Sev1 and Sev2, with Azure Automation runbooks triggering automated remediation for common resolvable conditions.
How does vorza360 use Azure Cost Management for cloud spending visibility and optimization?
Azure Cost Management is the native tool for analyzing, forecasting, and optimizing Azure spending, and vorza360 configures it as a proactive cost governance tool rather than a reactive invoice review mechanism. We implement Azure resource tagging policies that enforce cost allocation tags (environment, department, project, owner) on all resources at creation, enabling Cost Management to break down spending by these dimensions and attribute costs accurately to business units. We configure Azure Budgets with alert thresholds (at 80 percent and 100 percent of the monthly budget) that send notifications to both the technical team and finance before spending overruns occur. We generate monthly cost analysis reports segmented by service type, resource group, and tag dimension, identifying the top spending resources and trends. We use Cost Management’s Advisor recommendations to identify reserved instance purchase opportunities, right-sizing recommendations for underutilized VMs, and idle resource identification. We implement subscription-level spending controls using Azure Policy to require approval workflows for resource types that carry high cost risk.